Kumo
The area between Senkou Span A and Senkou Span BPrimary trend and support-resistance context.Price above, inside, or below the Cloud sets the first directional bias. Cloud color adds context, but it is not a forecast by itself.
Technical analysis study system
A source-linked Ichimoku guide for signals, setups, chart patterns, and risk.
Educational reference only. No live data, trade alerts, or buy and sell recommendations.
[S1][S2][S3][S4][M1][M2][M3]Read the five components as one balance system before looking for a trigger.
The area between Senkou Span A and Senkou Span BPrimary trend and support-resistance context.Price above, inside, or below the Cloud sets the first directional bias. Cloud color adds context, but it is not a forecast by itself.
(9-period high + 9-period low) / 2Fast equilibrium line.Tracks shorter-term price balance and forms the faster half of the TK relationship.
(26-period high + 26-period low) / 2Medium-term equilibrium line.Acts as a trend reference and a dynamic area to watch during pullbacks or bounces.
A: (Tenkan + Kijun) / 2. B: 52-period midpoint. Both plot 26 periods forward.The two boundaries of the Cloud.Their order colors the Kumo. Their separation expresses a zone, not a single support or resistance line.
Current close plotted 26 periods backHistorical confirmation layer.Compare it with prior price and Cloud structure. Congestion can weaken an otherwise attractive signal.
A TK cross has different weight above, inside, or below the Cloud.
Price above the Cloud
Price below the Cloud
Span A above Span B
Span A below Span B
Tenkan above Kijun
Tenkan below Kijun
Above prior price and Cloud
Below prior price and Cloud
Alignment increases context, not certainty. Inside the Cloud, directional conviction is lower.[S1][S3][S4]
Each setup needs conditions, a trigger, invalidation, and a known reason to pass.
The trend-aligned Tenkan-Kijun recross closes.
Price loses the broader Cloud bias or the recross immediately fails.
A cross against the Cloud trend is weaker and may be an exit signal rather than a new reversal trade.
Price tests Kijun and closes back in the trend direction.
Price accepts beyond Kijun and breaks the supporting structure.
Kijun is a dynamic reference, not a guaranteed exact turning price.
The entry edge breaks and holds inside the Cloud.
Price closes back through the entry edge.
This is the source author’s heuristic. Treat Cloud interiors as noisy and validate it on your market and timeframe.
Price confirms reversal behavior toward Kijun.
Trend acceleration continues and the reversal structure fails.
This is counter-trend by nature. Separation alone is not a trade signal.
Draw early if useful, but wait for completion before treating the pattern as actionable.
ContextContinuation or reversal?
CompletionDid the boundary break?
VolumeDoes participation confirm?
RiskWhere is the idea wrong?
TargetPattern depth is a guide, not a promise.
[S2]The supplied materials connect chart reading with sizing, exits, expectancy, and emotional discipline.
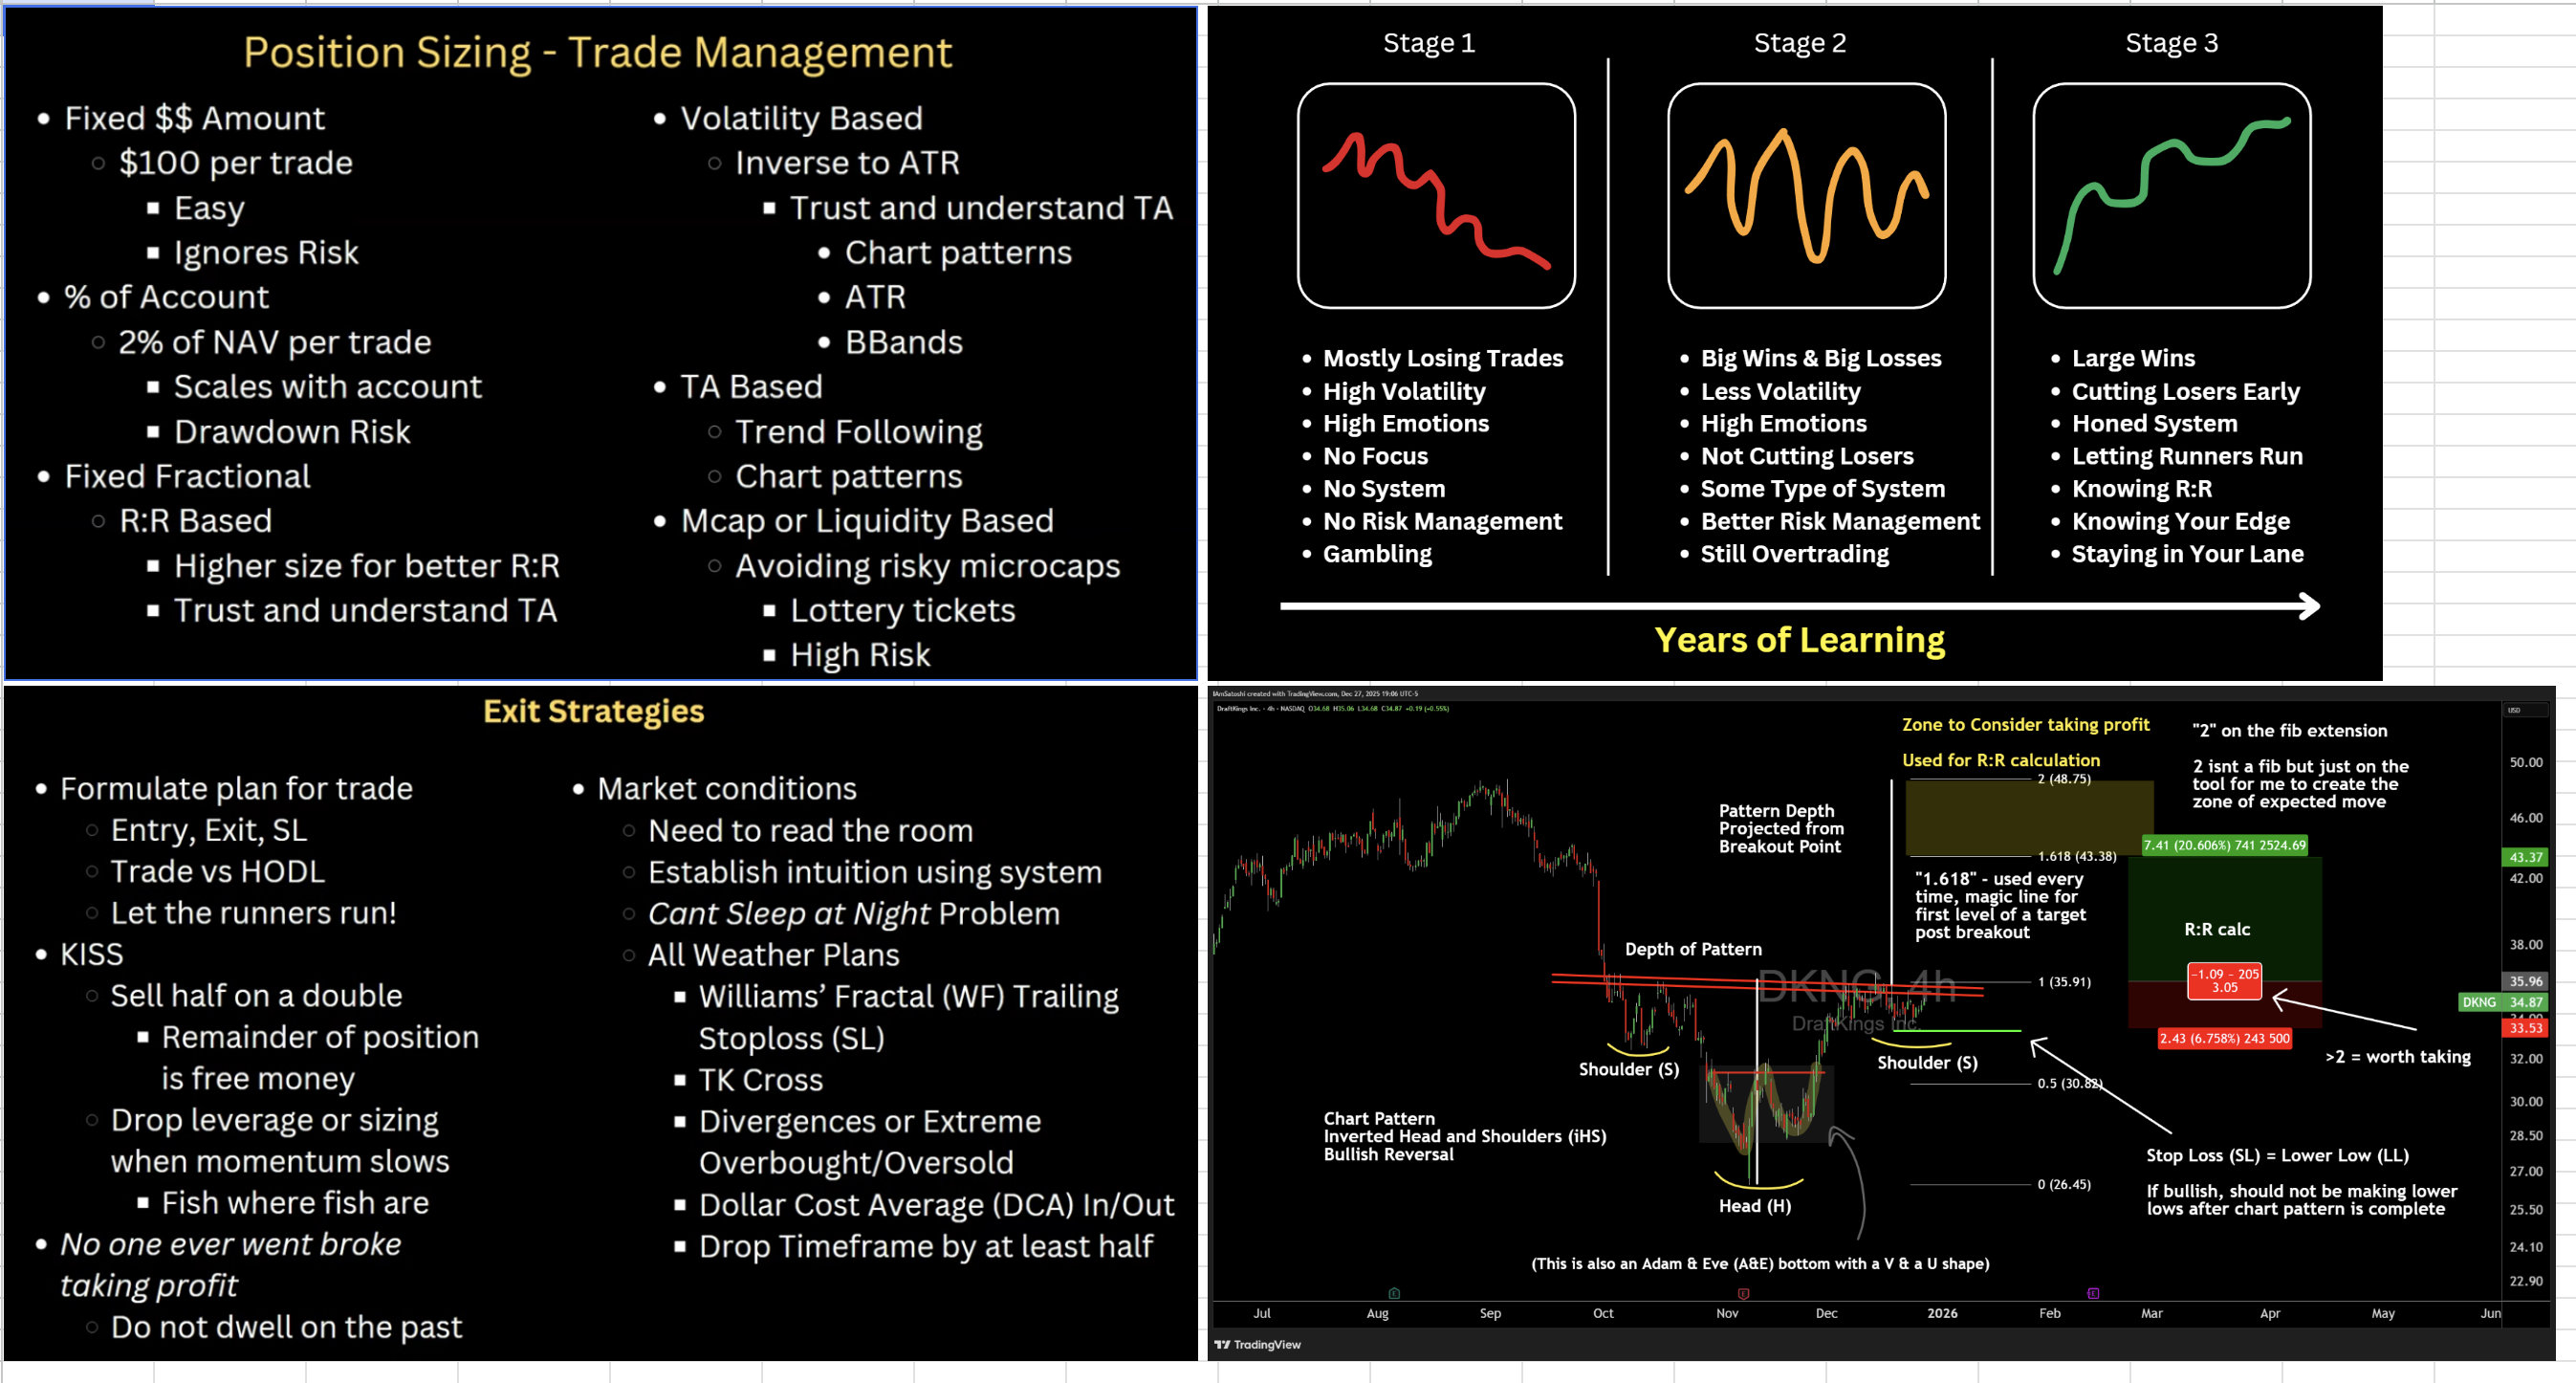
Compare sizing methods, pre-plan exits, and define stop and target logic before entry.
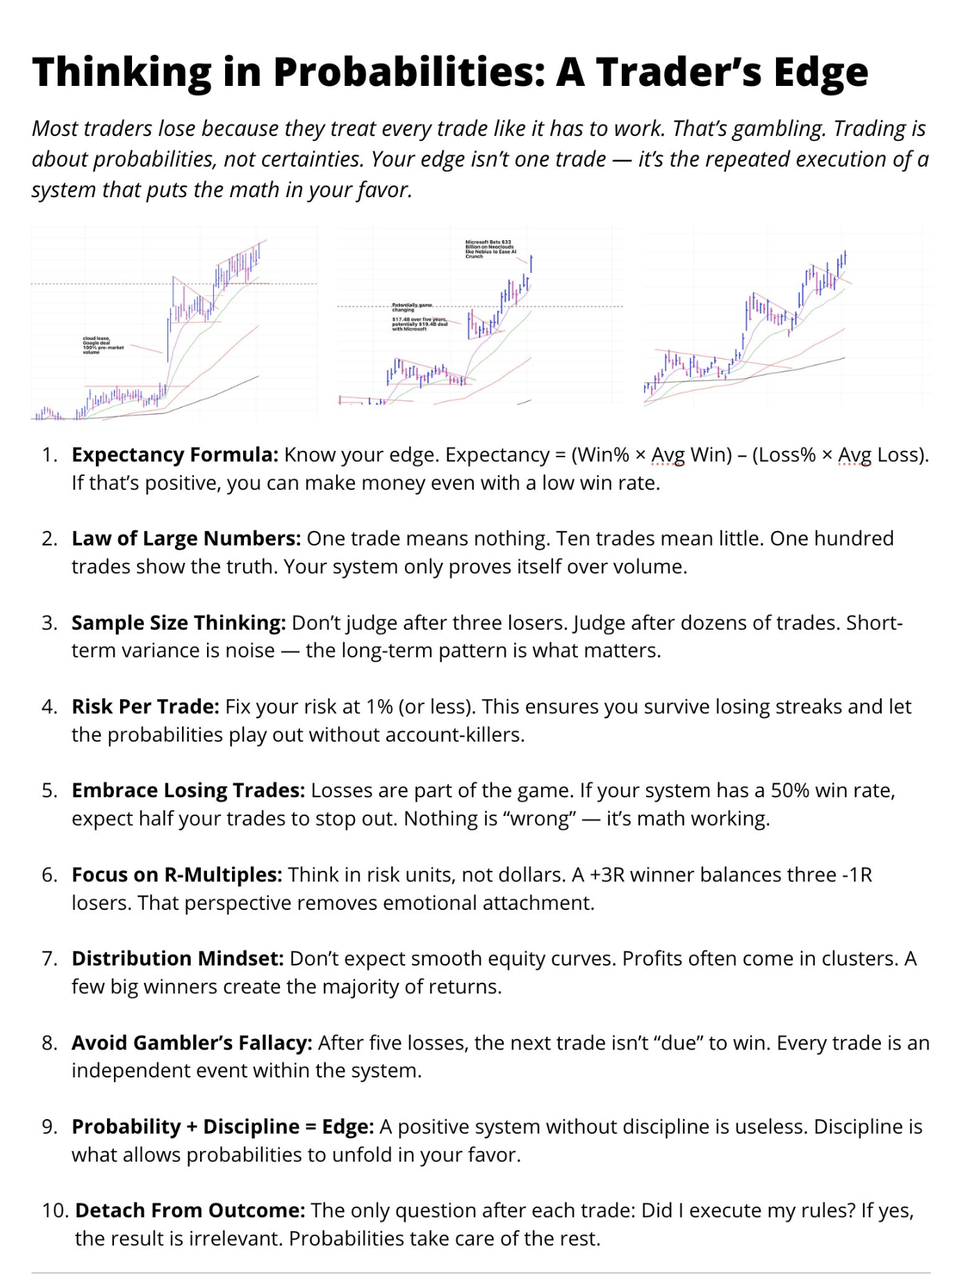
Evaluate expectancy across a sample and record outcomes in units of initial risk.
Choose a risk budget first, then derive position size from entry-to-stop distance and market liquidity.
[M1][M2]Write the target, stop, partial-exit rule, and trailing condition while the decision is still unemotional.
[M1]Track rule execution, R-multiples, and a meaningful sample. One trade cannot validate a system.
[M2]Use the index during chart review, then follow the source tag when you need the original context.
Search titles, concepts, and source-backed tags.
19 references
Primary trend and support-resistance context.
[S1][S3][S4]CoreTenkan-sen: Conversion LineFast equilibrium line.
[S3][S4]CoreKijun-sen: Base LineMedium-term equilibrium line.
[S1][S3][S4]CoreSenkou Spans A + B: Leading SpansThe two boundaries of the Cloud.
[S3][S4]CoreChikou Span: Lagging SpanHistorical confirmation layer.
[S1][S3][S4]SetupsTK recrossA momentum reset inside an established trend.
[S1][S3]SetupsKijun bounceA return toward medium-term equilibrium during a trend.
[S1][S3]SetupsCloud edge-to-edgeA range hypothesis after price closes inside the Kumo.
[S1]SetupsC-clampA mean-reversion watch when Tenkan and Kijun become unusually separated.
[S1]PatternsFlag or pennantImpulse, compact pause, breakout
[S2]PatternsAscending triangleFlat resistance, rising support
[S2]PatternsDescending triangleFlat support, falling resistance
[S2]PatternsCup and handleRounded recovery, controlled pullback
[S2]PatternsHead and shouldersThree peaks with a lower final failure
[S2]PatternsInverse head and shouldersThree troughs with a higher final recovery
[S2]PatternsDouble top or bottomTwo tests of a price extreme
[S2]PatternsAdam and EveSharp V paired with a rounded U
[S2]RiskPosition sizing lensesCompare account percentage, fixed fractional, volatility, technical, and liquidity-aware sizing.
[M1]RiskExpectancy and R-multiplesJudge the process across a sample, in risk units, instead of one outcome.
[M2]Keep the sequence stable so hindsight does not rewrite the rules.
Claims in this guide point back to these stored references. The two Medium articles remain the core reading.
#SatoshiMoku / CarpeNoctom
2018-01-17. Original Medium article. Member access may be required.#SatoshiMoku / CarpeNoctom
2018-12-18. Original Medium article. Member access may be required.StockCharts ChartSchool
Reference guide. Formula and interpretation reference.Fidelity Learning Center
Reference guide. Independent formula and signal reference.User-provided material
Provided 2026-08-19. Position sizing, exits, pattern targets, and learning stages.User-provided material
Provided 2026-08-19. Expectancy, sample size, R-multiples, and process discipline.User-provided material
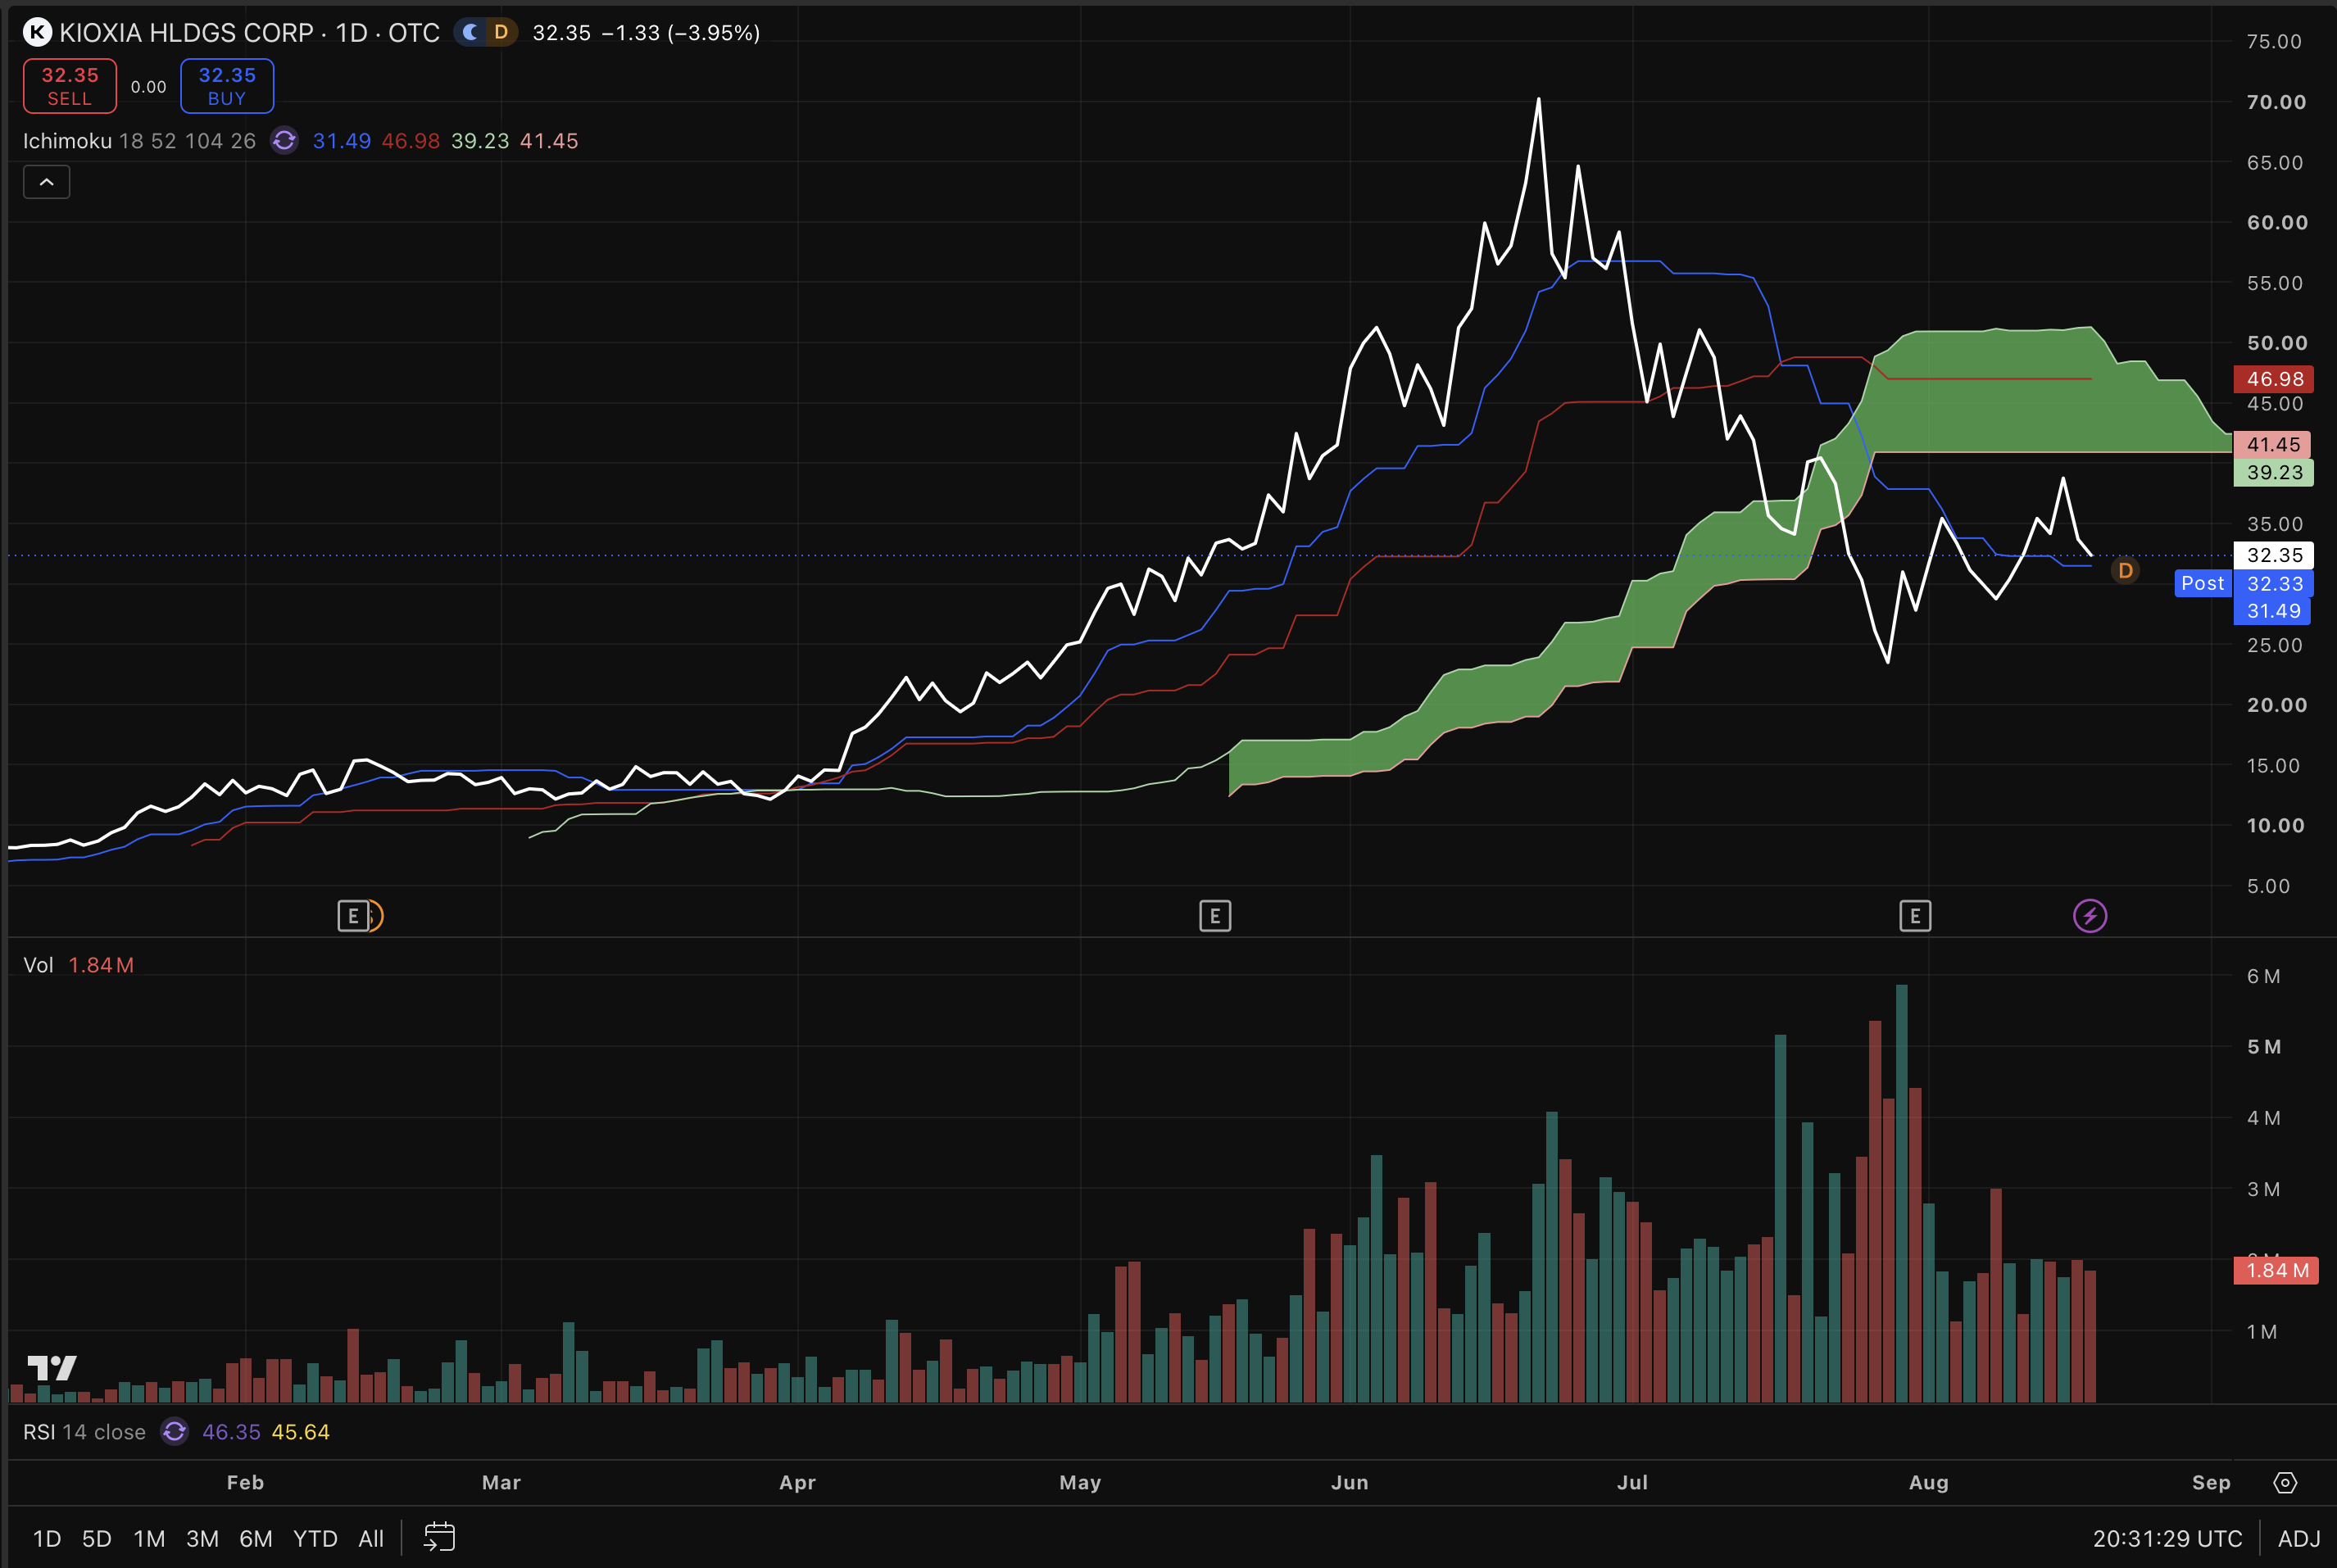
Provided 2026-08-19. Visual reference for chart-platform line, Cloud, price, and volume colors.